
Performance metrics for websites are essential for comprehending and enhancing the user experience in a manner that truly benefits real users. Typecially, there are several types of metrics that are relevant to how users perceive performance:
Perceived load speed: This refers to the rapidity with which a page loads and displays all visual elements on the screen.
Load responsiveness: This describes the speed at which a page loads and executes necessary JavaScript code, ensuring components respond swiftly to user actions.
Runtime responsiveness: This metric measures how quickly a page reacts to user interactions after it has fully loaded.
Visual stability: This assesses whether elements on the page move unexpectedly, potentially disrupting user interactions.
Smoothness: This evaluates whether transitions and animations render at a consistent frame rate and smoothly transition from one state to another.
Given these five dimensions, there is a general understanding of the performance characteristics of most websites. To directly capture and analyze these datasets, we can use a tool called Web Vitals, a Google initiative that aims to provide consistent guidance on web quality through metrics critical for delivering a great user experience.
Metrics in Web vitals
Below, I list all the metrics contained in web vitals. To provide a more sensible understanding of each metric, I will also include some related solutions for each one.
First Contentful Paint (FCP): FCP is a crucial web performance metric that gives insights into the user experience by measuring how quickly content starts appearing on the screen during the page load. Using a CDN, implementing server-side rendering (SSR), minifying static resources like CSS files, and lazy loading images are all effective methods to speed up page content loading and improve the FCP.
Largest Contentful Paint (LCP): Evaluates the time from when the page begins loading until the largest text block or image element is rendered. Optimizing images and assets by compressing them, serving next-gen formats like WebP, and lazy loading off-screen assets are essential practices. Additionally, improving server response time and prioritizing critical resources can significantly enhance LCP.
Interaction to Next Paint (INP): Assesses the delay of each tap, click, or keyboard interaction, and identifies the highest latency to describe overall page responsiveness. Optimizing event handling by debouncing or throttling events and reducing JavaScript execution time are effective ways to improve INP.
Total Blocking Time (TBT): calculates the total time between FCP and TTI (Time To Interactive) during which the main thread is blocked enough to hinder input responsiveness. Improving Total Blocking Time (TBT) can be achieved by optimizing JavaScript execution, handling third-party scripts efficiently, and minimizing the main thread's workload through techniques such as code splitting, using async and defer attributes, auditing and lazy loading external resources, breaking down long tasks, utilizing Web Workers, and optimizing render-blocking resources.
Cumulative Layout Shift (CLS): tracks the cumulative score of all unexpected layout shifts occurring between the start of page loading and the change to a hidden lifecycle state. One effective solution to improve CLS is to always include width and height size attributes on images and video elements, which prevents layout shifts by reserving the required space.
Time to First Byte (TTFB): measures the duration it takes for the network to respond with the first byte of a resource after a user request. To improve TTFB, optimize server configurations, use Content Delivery Networks (CDNs), reduce resource payloads, and leverage caching strategies.
These six universal metrics provide a solid foundation for measurement. Web Vitals, in an effort to simplify the scenario and help websites focus on the most important metrics, presents Core Web Vitals, a subset of Web Vitals that includes LCP (Largest Contentful Paint), INP (Interaction to Next Paint) and CLS ( Cumulative Layout Shift)
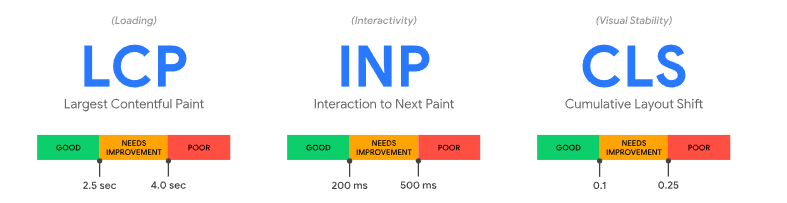
The three key indicators measure page performance from different perspectives: loading speed, interactivity, and visual stability.
To collect these metrics, Google offers the web-vitals library, which is approximately 1kB in size. This library helps gather not only the mentioned three metrics but also First Contentful Paint (FCP) and Time to First Byte (TTFB). For more information on how to use the web-vitals library, visit the web-vitals GitHub repository.
Custom metrics
Web-vitals metrics provide a general method to capture performance data. Custom metrics, on the other hand, allow you to assess unique aspects of your site's performance that are specific to your application, such as:
How long the browser's main thread is blocked affects the frame rate or input latency.
The duration for a page to present data retrieved from server.
The period required for a server-side-rendered (SSR) application to hydrate.
In numerous instances, it is necessary to evaluate beyond some critical metrics to thoroughly understand the complete experience of your specific site.
APIs for Custom Metric Measurement
User Timing API
User timing api provides a high-percision timestamps to measure the performance of the web site.
There are two categories of timing performance entries:
PerformanceMarkentries are named markers that can be placed anywhere within an application.javascriptCopy codePerformanceMeasureentries represent the time taken between two specified marks.javascriptCopy code
Performance Observer API
Browser Support
' d='M96 183a64 64 0 0 1-23-23L17 64a128 128 0 0 0 111 192l55-96a64 64 0 0 1-87 23Z'/%3E%3Cpath fill='url(%23b)' d='M192 128a64 64 0 0 1-9 32l-55 96A128 128 0 0 0 239 64H128a64 64 0 0 1 64 64Z'/%3E%3Ccircle cx='128' cy='128' r='52' fill='%231a73e8'/%3E%3Cpath fill='url(%23c)' d='M96 73a64 64 0 0 1 32-9h111a128 128 0 0 0-222 0l56 96a64 64 0 0 1 23-87Z'/%3E%3C/svg%3E)
' xlink:href='%23A'%3E%3Cstop offset='.76' stop-opacity='0'/%3E%3Cstop offset='.95' stop-opacity='.5'/%3E%3Cstop offset='1'/%3E%3C/radialGradient%3E%3CradialGradient id='F' cx='2523' cy='4680' r='20243' gradientTransform='matrix(-.03715 .99931 -2.12836 -.07913 13579 3530)' xlink:href='%23A'%3E%3Cstop offset='0' stop-color='%2335c1f1'/%3E%3Cstop offset='.11' stop-color='%2334c1ed'/%3E%3Cstop offset='.23' stop-color='%232fc2df'/%3E%3Cstop offset='.31' stop-color='%232bc3d2'/%3E%3Cstop offset='.67' stop-color='%2336c752'/%3E%3C/radialGradient%3E%3CradialGradient id='G' cx='24247' cy='7758' r='9734' gradientTransform='matrix(.28109 .95968 -.78353 .22949 24510 -16292)' xlink:href='%23A'%3E%3Cstop offset='0' stop-color='%2366eb6e'/%3E%3Cstop offset='1' stop-color='%2366eb6e' stop-opacity='0'/%3E%3C/radialGradient%3E%3Cpath id='H' d='M24105 20053a9345 9345 0 01-1053 472 10202 10202 0 01-3590 646c-4732 0-8855-3255-8855-7432 0-1175 680-2193 1643-2729-4280 180-5380 4640-5380 7253 0 7387 6810 8137 8276 8137 791 0 1984-230 2704-456l130-44a12834 12834 0 006660-5282c220-350-168-757-535-565z'/%3E%3Cpath id='I' d='M11571 25141a7913 7913 0 01-2273-2137 8145 8145 0 01-1514-4740 8093 8093 0 013093-6395 8082 8082 0 011373-859c312-148 846-414 1554-404a3236 3236 0 012569 1297 3184 3184 0 01636 1866c0-21 2446-7960-8005-7960-4390 0-8004 4166-8004 7820 0 2319 538 4170 1212 5604a12833 12833 0 007684 6757 12795 12795 0 003908 610c1414 0 2774-233 4045-656a7575 7575 0 01-6278-803z'/%3E%3Cpath id='J' d='M16231 15886c-80 105-330 250-330 566 0 260 170 512 472 723 1438 1003 4149 868 4156 868a5954 5954 0 003027-839 6147 6147 0 001133-850 6180 6180 0 001910-4437c26-2242-796-3732-1133-4392-2120-4141-6694-6525-11668-6525-7011 0-12703 5635-12798 12620 47-3654 3679-6605 7996-6605 350 0 2346 34 4200 1007 1634 858 2490 1894 3086 2921 618 1067 728 2415 728 2952s-271 1333-780 1990z'/%3E%3Cuse fill='url(%23B)' xlink:href='%23H'/%3E%3Cuse fill='url(%23D)' opacity='.35' xlink:href='%23H'/%3E%3Cuse fill='url(%23C)' xlink:href='%23I'/%3E%3Cuse fill='url(%23E)' opacity='.4' xlink:href='%23I'/%3E%3Cuse fill='url(%23F)' xlink:href='%23J'/%3E%3Cuse fill='url(%23G)' xlink:href='%23J'/%3E%3C/svg%3E)
' gradientUnits='userSpaceOnUse'%3E%3Cstop offset='.2' stop-color='%239059ff' stop-opacity='0'/%3E%3Cstop offset='.3' stop-color='%238c4ff3' stop-opacity='.1'/%3E%3Cstop offset='.8' stop-color='%237716a8' stop-opacity='.5'/%3E%3Cstop offset='1' stop-color='%236e008b' stop-opacity='.6'/%3E%3C/radialGradient%3E%3CradialGradient id='ff-g' cx='239.1' cy='34.6' r='171.6' gradientUnits='userSpaceOnUse'%3E%3Cstop offset='0' stop-color='%23ffe226'/%3E%3Cstop offset='.1' stop-color='%23ffdb27'/%3E%3Cstop offset='.3' stop-color='%23ffc82a'/%3E%3Cstop offset='.5' stop-color='%23ffa930'/%3E%3Cstop offset='.7' stop-color='%23ff7e37'/%3E%3Cstop offset='.8' stop-color='%23ff7139'/%3E%3C/radialGradient%3E%3CradialGradient id='ff-h' cx='374' cy='-74.3' r='732.2' gradientUnits='userSpaceOnUse'%3E%3Cstop offset='.1' stop-color='%23fff44f'/%3E%3Cstop offset='.5' stop-color='%23ff980e'/%3E%3Cstop offset='.6' stop-color='%23ff5634'/%3E%3Cstop offset='.7' stop-color='%23ff3647'/%3E%3Cstop offset='.9' stop-color='%23e31587'/%3E%3C/radialGradient%3E%3CradialGradient id='ff-i' cx='304.6' cy='7.1' r='536.4' gradientTransform='rotate(84 303 4)' gradientUnits='userSpaceOnUse'%3E%3Cstop offset='0' stop-color='%23fff44f'/%3E%3Cstop offset='.1' stop-color='%23ffe847'/%3E%3Cstop offset='.2' stop-color='%23ffc830'/%3E%3Cstop offset='.3' stop-color='%23ff980e'/%3E%3Cstop offset='.4' stop-color='%23ff8b16'/%3E%3Cstop offset='.5' stop-color='%23ff672a'/%3E%3Cstop offset='.6' stop-color='%23ff3647'/%3E%3Cstop offset='.7' stop-color='%23e31587'/%3E%3C/radialGradient%3E%3CradialGradient id='ff-j' cx='235' cy='98.1' r='457.1' gradientUnits='userSpaceOnUse'%3E%3Cstop offset='.1' stop-color='%23fff44f'/%3E%3Cstop offset='.5' stop-color='%23ff980e'/%3E%3Cstop offset='.6' stop-color='%23ff5634'/%3E%3Cstop offset='.7' stop-color='%23ff3647'/%3E%3Cstop offset='.9' stop-color='%23e31587'/%3E%3C/radialGradient%3E%3CradialGradient id='ff-k' cx='355.7' cy='124.9' r='500.3' gradientUnits='userSpaceOnUse'%3E%3Cstop offset='.1' stop-color='%23fff44f'/%3E%3Cstop offset='.2' stop-color='%23ffe141'/%3E%3Cstop offset='.5' stop-color='%23ffaf1e'/%3E%3Cstop offset='.6' stop-color='%23ff980e'/%3E%3C/radialGradient%3E%3ClinearGradient id='ff-a' x1='446.9' y1='76.8' x2='47.9' y2='461.8' gradientUnits='userSpaceOnUse'%3E%3Cstop offset='.1' stop-color='%23fff44f'/%3E%3Cstop offset='.1' stop-color='%23ffe847'/%3E%3Cstop offset='.2' stop-color='%23ffc830'/%3E%3Cstop offset='.4' stop-color='%23ff980e'/%3E%3Cstop offset='.4' stop-color='%23ff8b16'/%3E%3Cstop offset='.5' stop-color='%23ff672a'/%3E%3Cstop offset='.5' stop-color='%23ff3647'/%3E%3Cstop offset='.7' stop-color='%23e31587'/%3E%3C/linearGradient%3E%3ClinearGradient id='ff-l' x1='442.1' y1='74.8' x2='102.6' y2='414.3' gradientUnits='userSpaceOnUse'%3E%3Cstop offset='.2' stop-color='%23fff44f' stop-opacity='.8'/%3E%3Cstop offset='.3' stop-color='%23fff44f' stop-opacity='.6'/%3E%3Cstop offset='.5' stop-color='%23fff44f' stop-opacity='.2'/%3E%3Cstop offset='.6' stop-color='%23fff44f' stop-opacity='0'/%3E%3C/linearGradient%3E%3C/defs%3E%3Cpath d='M479 166c-11-25-32-52-49-60a249 249 0 0 1 25 73c-27-68-73-95-111-155a255 255 0 0 1-8-14 44 44 0 0 1-4-9 1 1 0 0 0 0-1 1 1 0 0 0-1 0c-60 35-81 101-83 134a120 120 0 0 0-66 25 71 71 0 0 0-6-5 111 111 0 0 1-1-58c-25 11-44 29-58 44-9-12-9-52-8-60l-8 4a175 175 0 0 0-24 21 210 210 0 0 0-22 26 203 203 0 0 0-32 73l-1 2-2 15a229 229 0 0 0-4 34v1a240 240 0 0 0 477 40l1-9c5-41 0-84-15-121zM202 355l3 1-3-1zm55-145zm198-31z' fill='url(%23ff-a)'/%3E%3Cpath d='M479 166c-11-25-32-52-49-60 14 26 22 53 25 72v1a207 207 0 0 1-206 279c-113-3-212-87-231-197-3-17 0-26 2-40-2 11-3 14-4 34v1a240 240 0 0 0 477 40l1-9c5-41 0-84-15-121z' fill='url(%23ff-b)'/%3E%3Cpath d='M479 166c-11-25-32-52-49-60 14 26 22 53 25 72v1a207 207 0 0 1-206 279c-113-3-212-87-231-197-3-17 0-26 2-40-2 11-3 14-4 34v1a240 240 0 0 0 477 40l1-9c5-41 0-84-15-121z' fill='url(%23ff-c)'/%3E%3Cpath d='m362 195 1 1a130 130 0 0 0-22-29C266 92 322 5 331 0c-60 35-81 101-83 134l9-1c45 0 84 25 105 62z' fill='url(%23ff-d)'/%3E%3Cpath d='M257 210c-1 6-22 26-29 26-68 0-80 41-80 41 3 35 28 64 57 79l4 2 7 3a107 107 0 0 0 31 6c120 6 143-143 57-186 22-4 45 5 58 14-21-37-60-62-105-62l-9 1a120 120 0 0 0-66 25l17 16c16 16 58 33 58 35z' fill='url(%23ff-e)'/%3E%3Cpath d='M257 210c-1 6-22 26-29 26-68 0-80 41-80 41 3 35 28 64 57 79l4 2 7 3a107 107 0 0 0 31 6c120 6 143-143 57-186 22-4 45 5 58 14-21-37-60-62-105-62l-9 1a120 120 0 0 0-66 25l17 16c16 16 58 33 58 35z' fill='url(%23ff-f)'/%3E%3Cpath d='m171 151 5 3a111 111 0 0 1-1-58c-25 11-44 29-58 44 1 0 36 0 54 11z' fill='url(%23ff-g)'/%3E%3Cpath d='M18 261a242 242 0 0 0 231 197 207 207 0 0 0 206-279c8 56-20 110-64 146-86 71-169 43-186 31l-3-1c-50-24-71-70-67-110-42 0-57-35-57-35s38-28 89-4c46 22 90 4 90 4 0-2-42-19-58-35l-17-16a71 71 0 0 0-6-5l-5-3c-18-11-52-11-54-11-9-12-9-51-8-60l-8 4a175 175 0 0 0-24 21 210 210 0 0 0-22 26 203 203 0 0 0-32 73c0 1-9 38-5 57z' fill='url(%23ff-h)'/%3E%3Cpath d='M341 167a130 130 0 0 1 22 29 46 46 0 0 1 4 3c55 50 26 121 24 126 44-36 72-90 64-146-27-68-73-95-111-155a255 255 0 0 1-8-14 44 44 0 0 1-4-9 1 1 0 0 0 0-1 1 1 0 0 0-1 0c-9 5-65 92 10 167z' fill='url(%23ff-i)'/%3E%3Cpath d='M367 199a46 46 0 0 0-4-3l-1-1c-13-9-36-18-58-15 86 44 63 193-57 187a107 107 0 0 1-31-6 131 131 0 0 1-11-5c17 12 99 39 186-31 2-5 31-76-24-126z' fill='url(%23ff-j)'/%3E%3Cpath d='M148 277s12-41 80-41c7 0 28-20 29-26s-44 18-90-4c-51-24-89 4-89 4s15 35 57 35c-4 40 16 85 67 110l3 1c-29-15-54-44-57-79z' fill='url(%23ff-k)'/%3E%3Cpath d='M479 166c-11-25-32-52-49-60a249 249 0 0 1 25 73c-27-68-73-95-111-155a255 255 0 0 1-8-14 44 44 0 0 1-4-9 1 1 0 0 0 0-1 1 1 0 0 0-1 0c-60 35-81 101-83 134l9-1c45 0 84 25 105 62-13-9-36-18-58-14 86 43 63 192-57 186a107 107 0 0 1-31-6 131 131 0 0 1-11-5l-3-1 3 1c-29-15-54-44-57-79 0 0 12-41 80-41 7 0 28-20 29-26 0-2-42-19-58-35l-17-16a71 71 0 0 0-6-5 111 111 0 0 1-1-58c-25 11-44 29-58 44-9-12-9-52-8-60l-8 4a175 175 0 0 0-24 21 210 210 0 0 0-22 26 203 203 0 0 0-32 73l-1 2-2 15a279 279 0 0 0-4 34v1a240 240 0 0 0 477 40l1-9c5-41 0-84-15-121zm-24 13z' fill='url(%23ff-l)'/%3E%3C/svg%3E)
' xlink:href='%23s-b'%3E%3Cstop offset='0' stop-color='%2324a5f3' stop-opacity='0' /%3E%3Cstop offset='1' stop-color='%231e8ceb' /%3E%3C/radialGradient%3E%3CradialGradient id='s-j' cx='109.3' cy='13.8' r='93.1' gradientTransform='matrix(-.02 1.1 -1.04 -.02 137 -115)' xlink:href='%23s-b'%3E%3Cstop offset='0' stop-opacity='0' /%3E%3Cstop offset='1' stop-color='%235488d6' stop-opacity='0' /%3E%3Cstop offset='1' stop-color='%235d96eb' /%3E%3C/radialGradient%3E%3C/defs%3E%3Crect width='220' height='220' x='22' y='-107' fill='url(%23s-a)' ry='49' transform='matrix(.57 0 0 .57 187 256)' /%3E%3Cg transform='translate(194 190)'%3E%3Ccircle cx='67.8' cy='67.7' fill='url(%23s-c)' paint-order='stroke fill markers' r='54' /%3E%3Ccircle cx='-69.9' cy='69.3' fill='url(%23s-i)' transform='translate(138 -2)' r='54' /%3E%3C/g%3E%3Cellipse cx='120' cy='14.2' fill='url(%23s-j)' rx='93.1' ry='93.7' transform='matrix(.58 0 0 .58 192 250)' /%3E%3Cg transform='matrix(.58 0 0 .57 197 182)'%3E%3Cpath fill='%23cac7c8' d='M46 192h1l72-48-7-9-66 57Z' /%3E%3Cpath fill='%23fbfffc' d='M46 191v1l66-57-7-9-59 65Z' /%3E%3Cpath fill='url(%23s-d)' d='m119 144-7-9 66-57-59 66Z' /%3E%3Cpath fill='%23fb645c' d='m105 126 7 9 66-57-1-1-72 49Z' /%3E%3C/g%3E%3Cpath stroke='%23fff' stroke-linecap='round' stroke-miterlimit='1' stroke-width='1.3' d='m287 278 3-2m-12-17 8-2m-8-3h4m-4-13 8 2m-8 3h4m-1-13 7 3m-4-11 7 4m-2-11 6 6m0-12 6 7m1-11 4 6m4-10 3 7m5-9 2 7m15-7-1 7m10-5-3 7m11-4-4 7m11-2-5 6m16 7-7 4m10 4-7 3m10 6-8 1m8 16-8-2m5 10-7-3m4 11-7-4m2 11-6-5m0 11-5-6m-2 11-4-7m-4 11-3-8m-6 10-1-8m-16 8 2-8m-10 5 3-7m-11 4 4-7m-11 2 5-6m-8 3 3-3m4 8 2-3m5 8 2-4m6 7 1-4m8 5v-4m8 4v-4m9 3-1-4m9 1-2-4m9 0-2-4m9-2-3-3m8-4-3-2m8-5-4-2m7-6-4-1m5-8h-4m4-8h-4m3-9-4 1m1-9-4 2m-1-9-3 2m-2-9-3 3m-4-8-2 3m-5-8-2 4m-6-6-1 3m-8-5v4m-8-4v4m-9-2 1 3m-9 0 2 3m-9 1 2 3m-9 2 3 3m-8 4 3 2m-8 5 4 2m-7 6 4 1m-4 25 4-1m-2 5 7-3m-6 7 4-2m-2 6 7-4m-13-21h8m41-41v-8m0 99v-8m49-42h-8' transform='translate(-65 8)' /%3E%3C/svg%3E)
The Performance Observer API collects and presents data from all other performance APIs, including the previously mentioned User Timing API. This allows you to use a preferred method to get notified about your custom performance measures:
javascriptCopy code
Performance Observer can passively subscribe to performance-related events, which means that this API usually does not interfere with the performance of the main page thread, as its callbacks are usually triggered during idle periods. And below all APIs can also be used as an observerable way:
Long Tasks Timing
Browser Support
The Long Tasks API is beneficial for identifying when the browser's main thread is obstructed for durations that could impact frame rate or input latency. This API reports tasks that take more than 50 milliseconds to execute.
It is advantageous to monitor if the main thread is blocked whenever you run resource-intensive code, or load and execute large scripts. Many higher-level metrics, such as Time to Interactive (TTI) and Total Blocking Time (TBT), are built on the Long Tasks API.
To detect long tasks, you can use PerformanceObserver and register it to observe
longtaskentries.javascriptCopy codeElement Timing
Browser Support
The aim of the Element Timing API is to give web developers or analytics tools the ability to measure rendering timestamps of critical elements(image and text node elements) on a page.
The below example, two elements are being observed by adding the
elementtimingattributetextCopy codeThen,the
PerformanceObservershould be registered to capture all performance entries of typeelement. Thebufferedflag is used to access data from before the observer's creation.javascriptCopy codeThe Largest Contentful Paint (LCP) metric helps in determining when the largest image or text block was painted on the screen, which may not always align with what you want to measure. For different elements, the Element Timing API can be used, which allows explicit reporting of any element by adding the
elementtimingattribute and using a PerformanceObserver to monitor theelemententry type.Event Timing
Browser Support
The Interaction to Next Paint (INP) metric assesses overall page responsiveness by observing all click, tap, and keyboard interactions throughout the life of a page. A page's INP is most often the interaction that took the longest to complete, from the time the user initiated the interaction, to the time the browser paints the next frame showing the visual result of the user's input.
The INP metric is made possible by the Event Timing API. This API exposes a number of timestamps that occur during the event lifecycle, including:
startTime: the time when the browser receives the event.processingStart: the time when the browser is able to begin processing event handlers for the event.processingEnd: time when the browser finishes executing all synchronous code initiated from event handlers for this event.duration: the time (rounded to 8 milliseconds for security reasons) between when the browser receives the event until it's able to paint the next frame after finishing executing all synchronous code initiated from the event handlers.
The following example shows how to use these these values to create custom measurements:
javascriptCopy code
Resource Timing
Using the Resource Timing API, you can retrieve and analyze detailed network timing data for the loading of an application's resources.
For each
PerformanceResourceTimingentry, a resource loading timeline will be documented with high-resolution timestamps for various network events such as redirect start and end times, DNS lookup start and end times, request start, response start and end times, among others.
For example, if we need to measure TCP handshake time, the calculation look like
connectEnd-connectStart.Typically, the code for measuring metrics looks like this:
javascriptCopy codeNavigation Timing
Browser Support
The Navigation Timing API, similar to the Resource Timing API, focuses exclusively on navigation requests. The
navigationentry type resembles theresourceentry type but includes additional details specific to navigation requests, such as the times when theDOMContentLoadedandloadevents occur.javascriptCopy codeServer Timing
The Server Timing API let you pass request-specific timing data from your server to the browser through response headers. For example, given a
Server-Timinglike this:textCopy codeA
PerformanceObservercan log the entries on the client side with the following code:javascriptCopy code
By default, the performance observer object can only observe entries as they appear. If we want to delay loading the performance analysis code (without blocking higher priority resources), we need to do this:
javascriptCopy code
Setting buffered to true will cause the browser to return the history of entries in its performance entry buffer the first time the performance observer callback is invoked.
Recap
Understanding and measuring web performance metrics are crucial for enhancing user experience. The core metrics from Google’s Web Vitals, including First Contentful Paint (FCP), Largest Contentful Paint (LCP), Interaction to Next Paint (INP), Total Blocking Time (TBT), Cumulative Layout Shift (CLS), and Time to First Byte (TTFB), offer essential insights into loading speed, interactivity, and visual stability of web pages.
Custom metrics provide additional granularity by assessing unique performance aspects using APIs like User Timing and Performance Observer. These tools allow developers to capture high-precision performance data, ensuring a comprehensive evaluation beyond standard metrics.
Ultimately, leveraging both universal and custom metrics facilitates a deeper understanding and enables targeted optimizations, paving the way for a robust, user-friendly web experience.